Grafana Cloud Review: The Managed LGTM Stack, and What It Costs
A hands-on look at Grafana Cloud in August 2026: the LGTM stack, the free tier limits, Pro and Enterprise pricing, cardinality bill shock, and who should pick Datadog instead.
Expert Review

What Grafana Cloud actually is
Almost everyone meets Grafana as the free dashboard tool bolted onto a Prometheus server: the panels, the graphs, the "Grafana" tab someone set up two jobs ago. Grafana Cloud is that same open-source Grafana, except Grafana Labs runs the databases behind it so you never stand up Prometheus, Loki, or a trace store yourself.
That distinction is the whole product. The dashboard has always been free and open. What you pay Grafana Labs for is the plumbing underneath: durable, queryable storage for your metrics, logs, traces, and profiles, plus the alerting, incident tooling, and synthetic checks stitched around it. You send telemetry in; they keep it, index it, and hand you a hosted Grafana to look at it.

What's in the box
The core is the stack engineers call LGTM, one open-source backend per signal:
- Mimir (metrics): a horizontally scalable Prometheus-compatible store. Grafana Labs pitches it as scaling past a billion active series, which is a way of saying the ceiling is not going to be your problem.
- Loki (logs): log storage that indexes labels rather than full text, so it stays cheap on object storage. Cheap to run is not the same as cheap to query loosely, which matters later.
- Tempo (traces): distributed tracing that needs only object storage to operate and links straight from a log line or a metric spike to the trace behind it.
- Grafana (the dashboards): the visualization layer, plus alerting, that ties all three together.
Around that core, Grafana Cloud bundles Pyroscope for continuous profiling, k6 for load testing, synthetic monitoring for uptime checks, and an incident-response suite (the tooling that grew out of Grafana OnCall). One login, one hosted Grafana, every signal in the same place. That single-pane story is the reason teams migrate off a pile of self-run components.
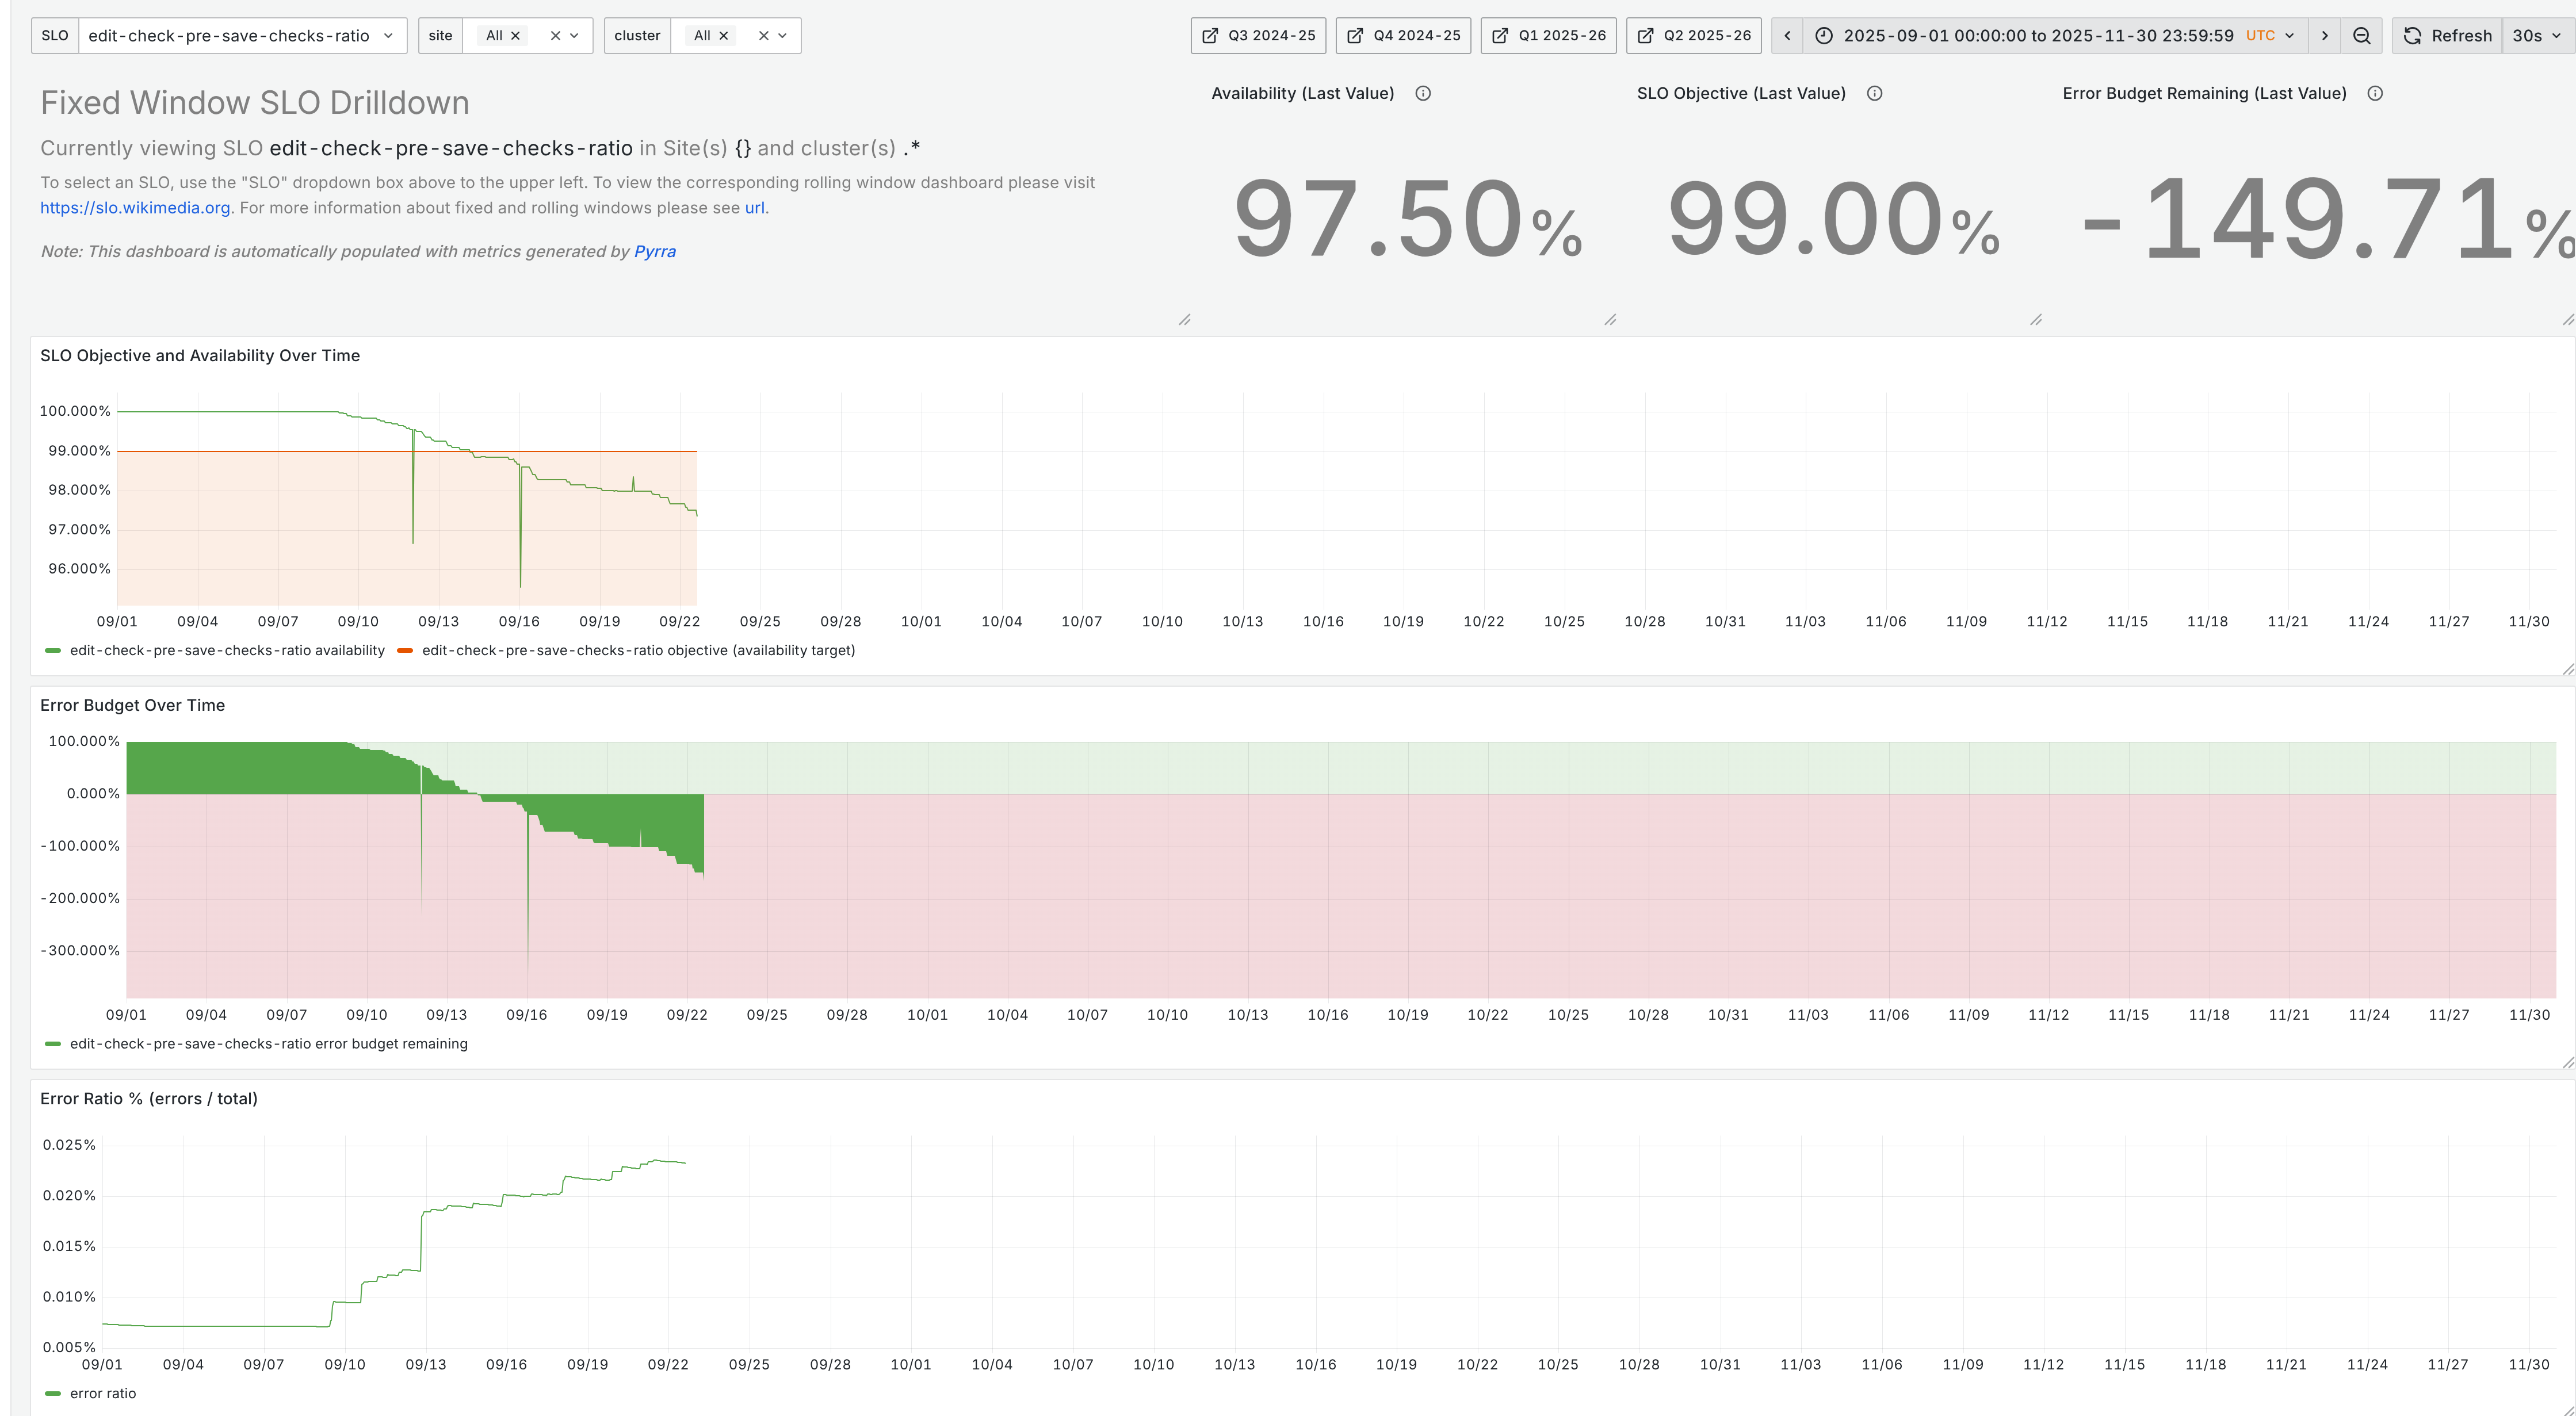
The free tier, from the signup flow
Sign up and the first thing it does not ask for is a credit card. The free tier is a real, permanent plan, not a countdown trial, checked on the pricing page in August 2026. It gives you 10,000 metrics active series, 50 GB of logs, 50 GB of traces, and 50 GB of profiles every month, all at 14-day retention, plus 500 k6 virtual-user hours.
The catch that bites first is not any of those numbers. It is the seat cap: three active Grafana users. For a solo developer or a two-person side project the free tier is genuinely enough to run production monitoring. Add a fourth engineer who needs to log in, and you are into a paid plan regardless of how little data you send. Support on the free tier is the community forum and nothing else.
Fourteen-day retention is the other quiet limit. It is fine for "is the site up right now." It is not enough to compare this week's latency against last month's release, which is exactly the question you will eventually want to ask.
Pricing, and why the invoice has seven lines
Paid Grafana Cloud is not one price. It is a platform fee plus a separate usage meter for every signal, and understanding that is the difference between a predictable bill and a nasty one.
The Pro plan, as listed in August 2026, starts at a $19/month platform fee that carries the base free allowances with it. Above those allowances you pay by usage:
- Metrics: $6.50 per 1,000 active series beyond the first 10,000, with retention stretched to 13 months.
- Logs and traces: billed in parts, not as one per-GB rate. Logs run roughly $0.05/GB to process, $0.40/GB to write, $0.10/GB to retain, and $0.003/GB to query, above the 50 GB free, at 30-day retention. Traces follow the same three-part structure.
- k6 load testing: $0.15 per virtual-user hour once the 500 free hours are gone.
This is where the invoice gets its reputation. What reads as "one tool" on the dashboard shows up as half a dozen or more line items on the bill, because each backend meters itself. Metrics, log ingest, log processing, log retention, log queries, traces, k6: they are all counted separately. Nothing is hidden, but nothing is summarized either, and the first month after you leave the free tier is usually the month you learn how your own systems actually behave.
Advanced and Enterprise is the negotiated tier and starts around a $25,000/year committed spend. That commitment buys lower unit rates (metrics can drop toward $3 per 1,000 series with volume), custom retention, premium support, and deployment options up to bring-your-own-cloud and a Federal offering. Below roughly that scale, you are on published Pro rates unless a salesperson decides otherwise, and buyers who commit annually commonly report shaving 10-20% off list.
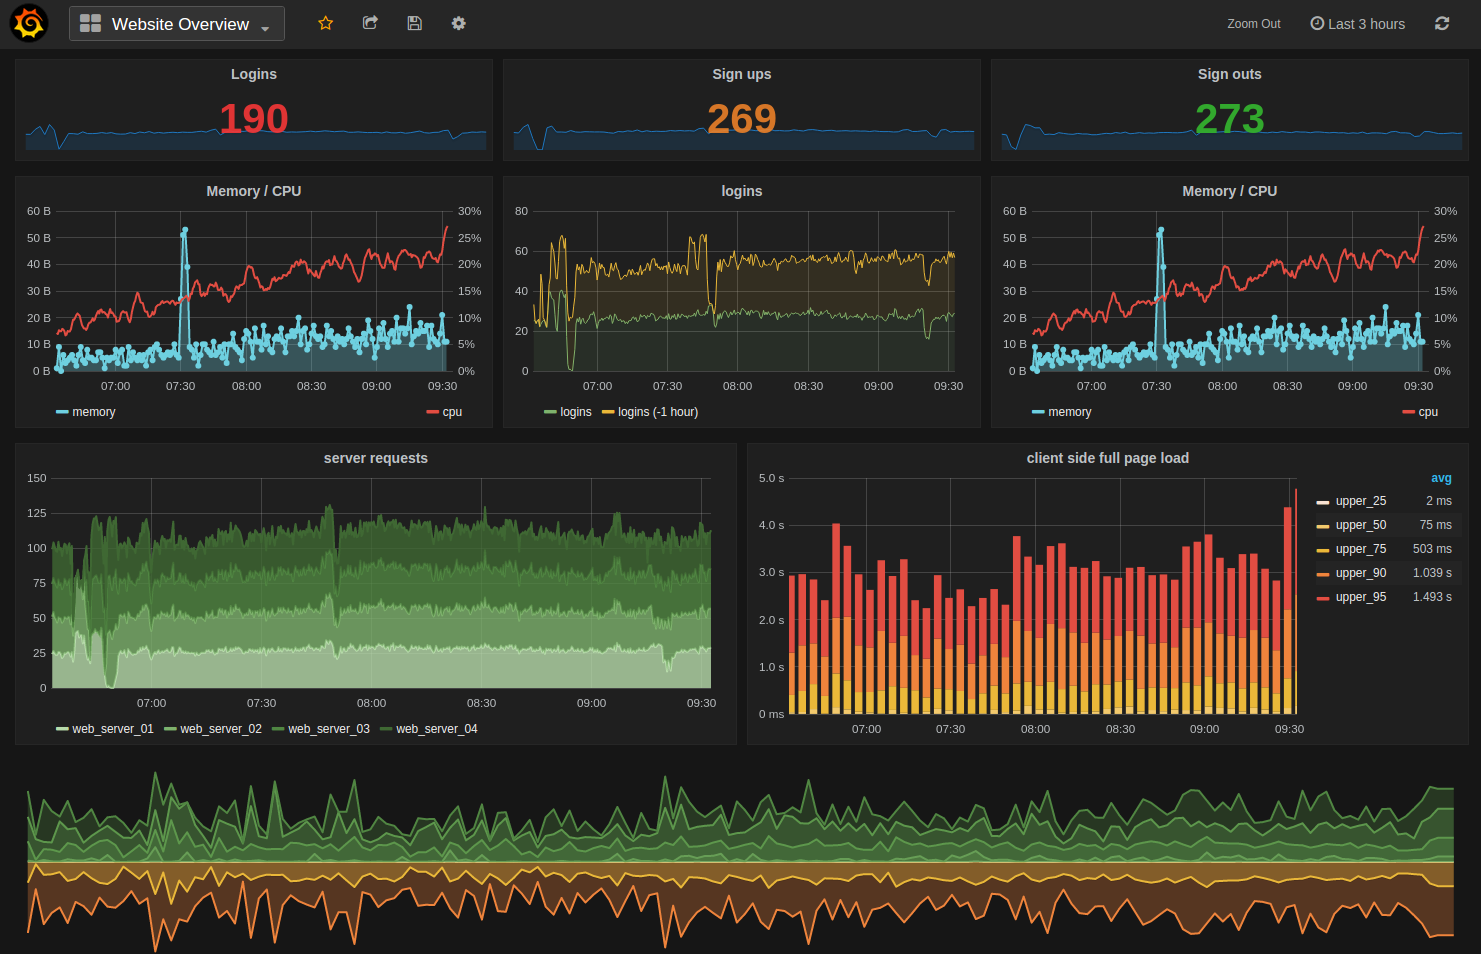
Where the bill really comes from
Almost every Grafana Cloud bill-shock story traces to one word: cardinality. Metrics are priced by active series, and an active series is a unique combination of a metric name and its labels. Add a label with high variety, like a pod ID, a customer ID, or a request path, and one metric quietly explodes into thousands of series.
Kubernetes is the usual culprit. A single busy cluster can generate well over 100,000 billable series on its own, most of them from labels no dashboard or alert ever reads. You are paying $6.50 per 1,000 for series that exist only because a scrape target attached a label nobody queries.
Grafana Labs' answer is Adaptive Metrics, and it is a genuine reason to run Pro rather than assemble the same stack yourself. It analyzes which series your dashboards, alerts, and recording rules actually touch, then aggregates away the labels that only inflate cardinality. Grafana reports early users trimming 20-50% of their time series with no loss of visibility, and it is included at no extra charge on Pro and Advanced. The important word is recommendations: it hands you a list to apply and review, not a setting you flip once. Cost control here is an ongoing habit, not a one-time toggle.
Logs are the second driver, and the cause is duller: debug-level logging left on in production ships far more data than anyone estimated. Because log ingest, retention, and querying each bill on their own meter, a chatty service is expensive three ways at once.
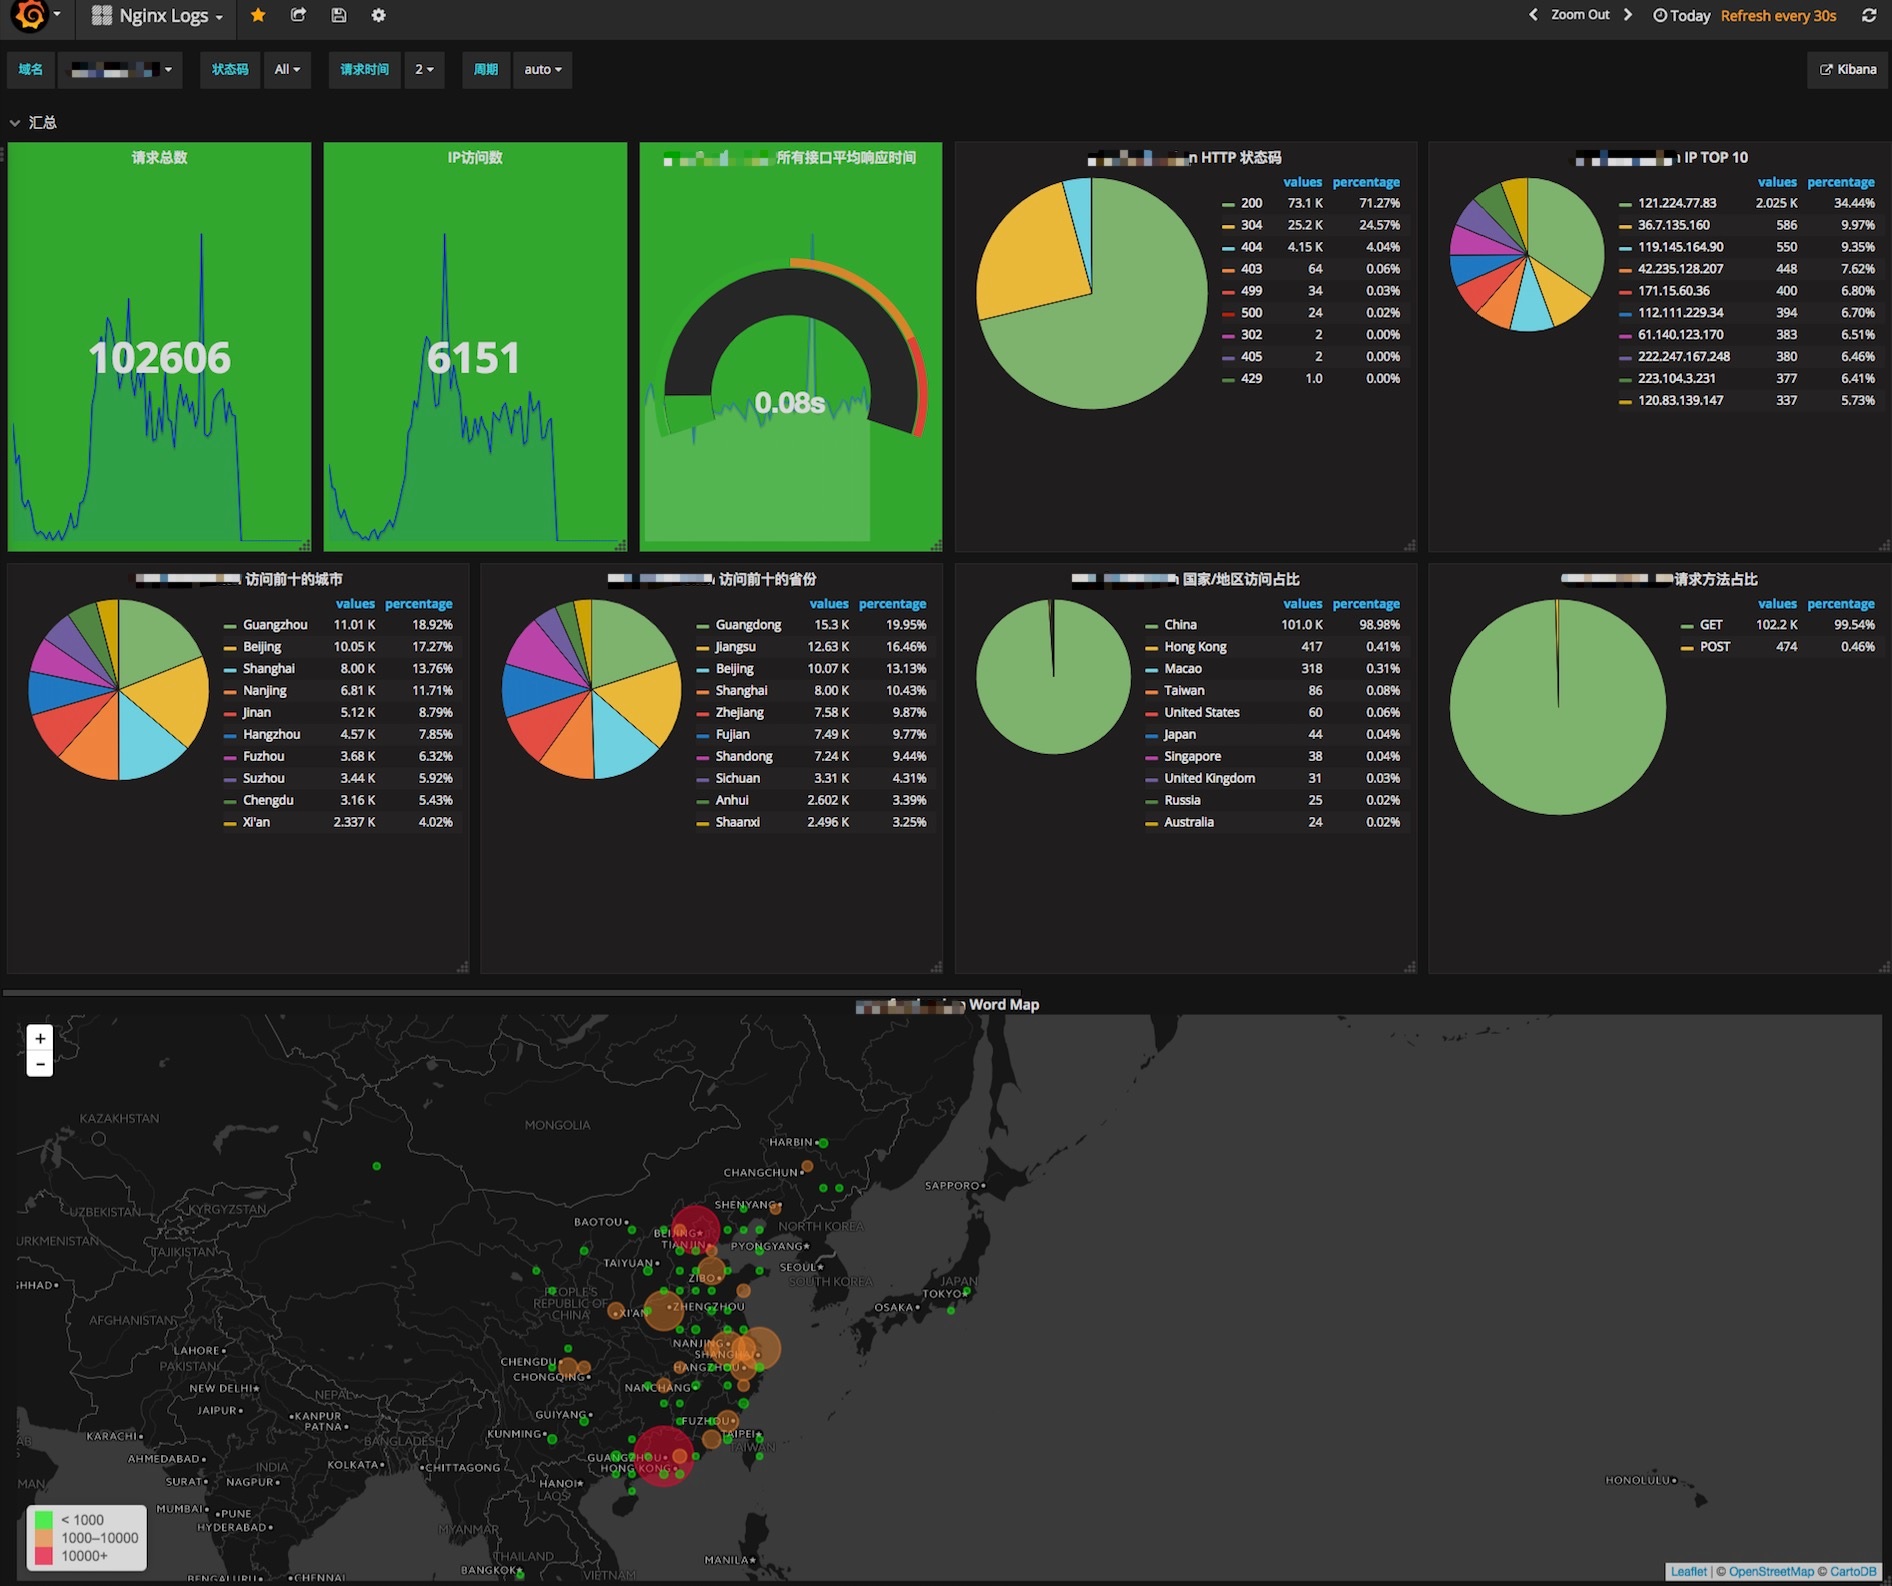
Grafana Cloud vs Datadog vs self-hosting
The two real alternatives sit on either side of Grafana Cloud, and the choice is mostly about who absorbs the operational work.
Against Datadog, the pitch is cost and openness. Datadog is the turnkey option: it tends to "just work" with less tuning, and it is the tool most teams reach for when they want an incident resolved rather than a config understood. It is also famous for invoices that run several times higher, and its per-host and per-custom-metric pricing has its own cardinality traps. Grafana Cloud is cheaper and built on open standards you can walk away with, but it asks more of you: you will think about series counts and retention in a way Datadog lets you ignore until the bill arrives anyway.
Against self-hosting, the trade is money for time. Every backend Grafana Cloud runs, Mimir, Loki, Tempo, is open source and free to operate yourself. The moment your telemetry matters, though, you are running a distributed database with its own storage, scaling, and 3 a.m. failure modes. Grafana Cloud exists so a small team can skip that. A team that already has the platform engineers to run it, and enough volume to make the maths work, should keep self-hosting.
Who should buy it, and who should not
Grafana Cloud is the right call for a team already living in Prometheus and Grafana who wants the storage backends run for them without adopting a closed platform. If you are a solo builder or a tiny team, the free tier is one of the most generous in observability and can carry real production monitoring at zero cost, as long as you stay under three users and 14-day retention. For everyone paying, the deciding factor is whether you will actually use Adaptive Metrics and watch your cardinality; treat that as homework and the bill is very competitive.
Skip it if you want a flat, predictable invoice and a tool that resolves incidents without you learning how it is billed. A multi-meter usage model punishes teams that will not tune it, and for them the higher, simpler Datadog bill is the cheaper mistake. Skip it too if you already run the open-source LGTM stack well at scale, because the managed version is a convenience you have already built and would only be paying for twice.
Start on the Grafana Cloud free tier and send it a week of real traffic before you commit. The free plan is the honest way to find out what your own systems will cost.
Ready to try Grafana Cloud?
Visit the official website to see the latest plans, pricing, and special offers.
Get Started - Grafana Cloud* Affiliate link - we may earn a commission at no extra cost to you.